Electricity prices across Europe, today
Live day-ahead prices for 19 European bidding zones, updated as soon as the market publishes them. Pick a country for hour-by-hour prices, the cheapest windows and what a kWh really costs at home.
- 19Bidding zones
- 96Prices per zone and day
- 19Languages
- NL
- BE
- DE-LU
- AT
- CH
- FR
- IT-NORD
- PL
- CZ
- HU
- SI
- ES
- PT
- DK1
- DK2
- SE3
- SE4
- NO2
- GB
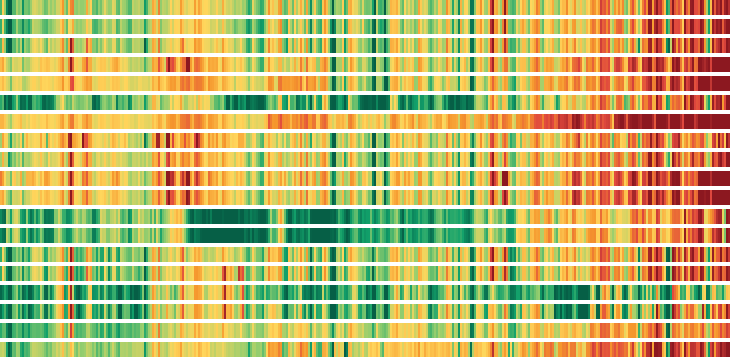
Today · 19 Bidding zones
Ranking Sweden (Stockholm, SE3) Expensive258.26
 Italy (North) Largest intraday spread299
 Spain
Europe price map
Wholesale day-ahead average per bidding zone, before taxes.
Cheapest and dearest
Cheap€/MWh
- Sweden (Stockholm, SE3)SE374.73
- Sweden (Malmö, SE4)SE4141.86
- SpainES146.97
 PortugalPT146.97
 PolandPL157.93
Expensive€/MWh
- Italy (North)IT-NORD258.26
 HungaryHU252.42
 SwitzerlandCH240.19
 SloveniaSI235.76
 AustriaAT235.67
Country editions
Full pages with final price estimates, cheapest hours and planners.
 Netherlands202.4 €/MWh0006121824 13:00 08:00BE−6.9%
 Belgium196.1 €/MWh0006121824 13:45 09:00DE-LU+8.3%
 Luxembourg211.9 €/MWh0006121824 23:45 08:00DE-LU+8.3%
 Germany211.9 €/MWh0006121824 23:45 08:00AT−2.9% Austria235.7 €/MWh0006121824 23:45 16:45CH−0.4% Switzerland240.2 €/MWh0006121824 03:00 08:00FR−24.0%
 France161.3 €/MWh0006121824 15:30 09:00IT-NORD−2.0% Italy258.3 €/MWh0006121824 23:45 07:45PL−14.0% Poland157.9 €/MWh0006121824 15:45 15:15CZ+4.6%
 Czechia209.8 €/MWh0006121824 23:45 16:45HU−22.7% Hungary252.4 €/MWh0006121824 11:15 07:00SI−9.7% Slovenia235.8 €/MWh0006121824 11:15 16:45ES−24.8% Spain147.0 €/MWh0006121824 15:30 21:00PT−24.8% Portugal147.0 €/MWh0006121824 14:30 20:00DK1+10.6%
 Denmark198.3 €/MWh0006121824 02:00 09:00SE3−36.3% Sweden74.7 €/MWh0006121824 05:00 15:45NO2+0.3%
 Norway169.0 €/MWh0006121824 23:45 09:45GB+0.6%
 United Kingdom207.6 €/MWh0006121824 22:00 18:00
Price matrix
Hourly average by bidding zone, €/MWh, local time of each zone
| Zone | 00 | 01 | 02 | 03 | 04 | 05 | 06 | 07 | 08 | 09 | 10 | 11 | 12 | 13 | 14 | 15 | 16 | 17 | 18 | 19 | 20 | 21 | 22 | 23 | Ø |
|---|---|---|---|---|---|---|---|---|---|---|---|---|---|---|---|---|---|---|---|---|---|---|---|---|---|
| NLNetherlands | 174 | 175 | 169 | 172 | 175 | 178 | 215 | 244 | 264 | 244 | 224 | 203 | 184 | 161 | 181 | 192 | 214 | 238 | 237 | 246 | 223 | 195 | 184 | 164 | 202.4 |
| BEBelgium | 175 | 177 | 170 | 171 | 173 | 177 | 210 | 240 | 263 | 244 | 220 | 198 | 174 | 150 | 155 | 157 | 179 | 220 | 236 | 246 | 224 | 197 | 186 | 165 | 196.1 |
| DE-LUGermany & Luxembourg | 172 | 174 | 168 | 173 | 176 | 179 | 225 | 257 | 265 | 244 | 228 | 220 | 197 | 206 | 210 | 231 | 252 | 259 | 244 | 246 | 222 | 194 | 183 | 161 | 211.9 |
| ATAustria | 202 | 194 | 192 | 195 | 198 | 204 | 241 | 268 | 268 | 244 | 255 | 265 | 206 | 244 | 234 | 266 | 286 | 275 | 259 | 252 | 244 | 235 | 228 | 202 | 235.7 |
| CHSwitzerland | 217 | 210 | 209 | 201 | 201 | 215 | 248 | 259 | 265 | 260 | 258 | 259 | 242 | 238 | 244 | 255 | 261 | 261 | 261 | 258 | 251 | 245 | 234 | 214 | 240.2 |
| FRFrance | 178 | 178 | 168 | 162 | 160 | 166 | 184 | 226 | 258 | 244 | 206 | 168 | 125 | 15 | 40 | 4 | 4 | 119 | 235 | 247 | 226 | 200 | 189 | 168 | 161.3 |
| IT-NORDItaly (North) | 219 | 209 | 209 | 213 | 212 | 220 | 255 | 312 | 318 | 297 | 294 | 277 | 260 | 252 | 256 | 269 | 286 | 286 | 285 | 290 | 275 | 252 | 239 | 212 | 258.3 |
| PLPoland | 140 | 138 | 136 | 136 | 142 | 160 | 175 | 183 | 146 | 154 | 170 | 169 | 174 | 168 | 207 | 188 | 142 | 146 | 168 | 154 | 145 | 168 | 151 | 133 | 157.9 |
| CZCzechia | 170 | 190 | 177 | 193 | 193 | 172 | 222 | 255 | 265 | 244 | 185 | 171 | 194 | 189 | 219 | 249 | 270 | 268 | 248 | 242 | 212 | 179 | 177 | 154 | 209.8 |
| HUHungary | 256 | 263 | 263 | 263 | 262 | 256 | 275 | 333 | 271 | 244 | 182 | 152 | 194 | 187 | 224 | 258 | 278 | 272 | 275 | 266 | 282 | 278 | 270 | 253 | 252.4 |
| SISlovenia | 219 | 209 | 209 | 210 | 212 | 220 | 255 | 282 | 270 | 244 | 196 | 169 | 199 | 203 | 231 | 266 | 286 | 275 | 260 | 259 | 263 | 252 | 243 | 222 | 235.8 |
| ESSpain | 178 | 178 | 168 | 162 | 160 | 166 | 184 | 226 | 258 | 197 | 79 | 2 | 1 | 1 | 1 | 0 | 1 | 69 | 193 | 255 | 284 | 285 | 254 | 225 | 147.0 |
| PTPortugal | 178 | 178 | 168 | 162 | 160 | 166 | 184 | 226 | 258 | 197 | 79 | 2 | 1 | 1 | 1 | 0 | 1 | 69 | 193 | 255 | 284 | 285 | 254 | 225 | 147.0 |
| DK1West Denmark (DK1) | 163 | 161 | 152 | 159 | 161 | 163 | 191 | 222 | 237 | 239 | 225 | 208 | 194 | 185 | 184 | 201 | 227 | 251 | 240 | 246 | 221 | 193 | 180 | 159 | 198.3 |
| DK2East Denmark (DK2) | 172 | 170 | 164 | 169 | 172 | 176 | 219 | 254 | 265 | 244 | 226 | 213 | 198 | 206 | 209 | 227 | 252 | 259 | 244 | 245 | 220 | 190 | 178 | 157 | 209.5 |
| SE3Sweden (Stockholm, SE3) | 53 | 46 | 38 | 34 | 37 | 43 | 65 | 56 | 59 | 81 | 70 | 69 | 79 | 76 | 83 | 109 | 133 | 117 | 113 | 109 | 103 | 85 | 73 | 63 | 74.7 |
| SE4Sweden (Malmö, SE4) | 120 | 85 | 50 | 51 | 45 | 57 | 147 | 76 | 82 | 198 | 164 | 153 | 158 | 126 | 158 | 201 | 233 | 231 | 220 | 214 | 195 | 166 | 143 | 132 | 141.9 |
| NO2Norway (South-West, NO2) | 165 | 165 | 159 | 164 | 166 | 165 | 169 | 172 | 172 | 176 | 174 | 172 | 172 | 172 | 172 | 172 | 172 | 172 | 173 | 172 | 171 | 170 | 168 | 154 | 169.0 |
| GBGreat Britain | 185 | 182 | 180 | 176 | 176 | 176 | 200 | 233 | 243 | 243 | 234 | 219 | 204 | 197 | 194 | 196 | 194 | 232 | 239 | 250 | 239 | 218 | 200 | 173 | 207.6 |
Europe over the last 12 months
The daily day-ahead average across all bidding zones, with the range from the cheapest to the most expensive zone.
- 12-month average
- 106.9 €/MWh
- Cheapest month
- 77.6 €/MWhApril 2026
- Most expensive month
- 171.2 €/MWhOctober 2026
- Cheapest bidding zone
- 67.6 €/MWh Sweden (Stockholm, SE3)
Germany & LuxembourgOpen →Largest intraday spread
Highest minus lowest price today, €/MWh
€/MWh · Wholesale price
Tools
Ranking
All bidding zones by today's average day-ahead price
| # | Zone | Today avg. | vs yesterday | Tomorrow avg. | Lowest | Highest | Last 30 days |
|---|---|---|---|---|---|---|---|
| 1 | Sweden (Stockholm, SE3) SE3 | 74.73 | −36.3% | 63.30 | 21.71 | 140.18 | |
| 2 | Sweden (Malmö, SE4) SE4 | 141.86 | −20.6% | 134.45 | 22.04 | 242.82 | |
| 3 | Spain ES | 146.97 | −24.8% | 155.63 | 0.30 | 299.00 | |
| 4 | Portugal PT | 146.97 | −24.8% | 155.63 | 0.30 | 299.00 | |
| 5 | Poland PL | 157.93 | −14.0% | 228.61 | 115.18 | 235.33 | |
| 6 | France FR | 161.33 | −24.0% | 156.28 | 0.30 | 273.85 | |
| 7 | Norway (South-West, NO2) NO2 | 169.04 | +0.3% | 138.48 | 146.78 | 175.69 | |
| 8 | Belgium BE | 196.07 | −6.9% | 152.48 | 136.66 | 273.91 | |
| 9 | West Denmark (DK1) DK1 | 198.33 | +10.6% | 148.01 | 145.26 | 264.69 | |
| 10 | Netherlands NL | 202.36 | +8.6% | 150.43 | 136.99 | 275.70 | |
| 11 | Great Britain GB | 207.59 | +0.6% | 183.82 | 173.30 | 249.51 | |
| 12 | East Denmark (DK2) DK2 | 209.48 | +9.0% | 149.50 | 148.87 | 281.16 | |
| 13 | Czechia CZ | 209.78 | +4.6% | 202.03 | 143.37 | 282.72 | |
| 14 | Germany & Luxembourg DE-LU | 211.94 | +8.3% | 148.61 | 152.81 | 279.61 | |
| 15 | Austria AT | 235.67 | −2.9% | 222.49 | 180.00 | 300.22 | |
| 16 | Slovenia SI | 235.76 | −9.7% | 228.63 | 163.81 | 299.89 | |
| 17 | Switzerland CH | 240.19 | −0.4% | 223.36 | 200.92 | 265.00 | |
| 18 | Hungary HU | 252.42 | −22.7% | 263.21 | 144.83 | 365.43 | |
| 19 | Italy (North) IT-NORD | 258.26 | −2.0% | 234.74 | 198.81 | 339.00 |
€/MWh · Wholesale price
Electricity price guides
How electricity prices work – explained with data from the European day-ahead market, updated every day.
How it works
Noon auction
Every day at 12:00 CET the European market sets 96 quarter-hour prices for the next day.
Published ~13:00
We pick up the official results within minutes and check them against a second source.
Your real price
We add taxes, network charges and a sample supplier margin to estimate the final price per kWh.
You plan
The cheapest windows and the appliance planner show when to run what – and what you save.
FAQ
When are tomorrow's prices published?
Why are prices sometimes negative?
Is the final price exactly what I pay?
Methodology
Wholesale prices
We use the official day-ahead prices of the single European market coupling (SDAC). Since 1 October 2025 the market works in 15-minute periods, so each day has 96 prices (92 or 100 on clock-change days).
Final price estimate
For countries with a full model we add the official taxes, network charges and VAT valid on that day, plus a sample supplier margin you can see in the breakdown. Fixed monthly or daily fees are not spread over the kWh price.